Live Dashboard
Cluster Dashboard
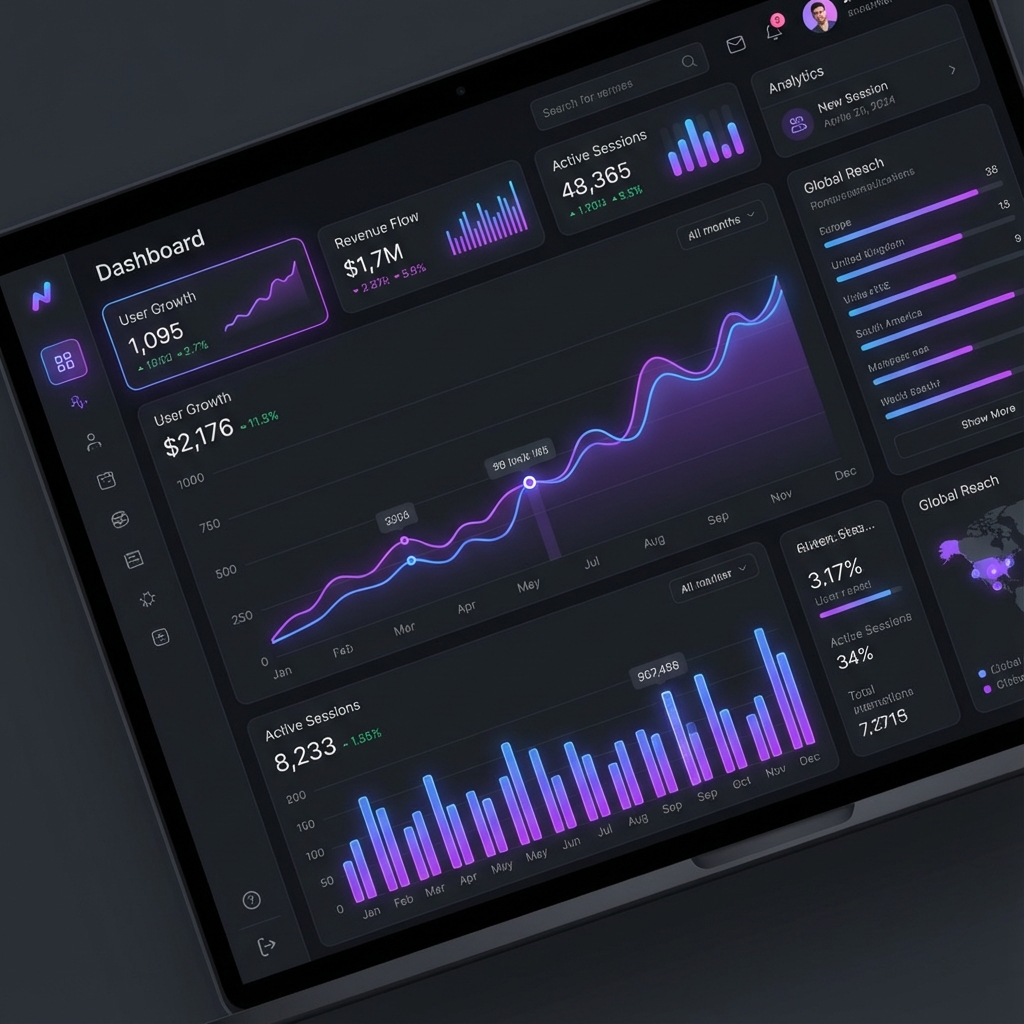
Live embedded Grafana dashboard showing real-time metrics from my Kubernetes cluster.
This dashboard monitors a self-hosted Kubernetes cluster running on bare metal servers. It tracks CPU, memory, network, and storage metrics across all nodes and pods.
Built with Prometheus for metrics collection and Grafana for visualization, this demonstrates seamless integration of monitoring tools into web applications.
KubernetesGrafanaPrometheusMonitoringInfrastructure

Live View