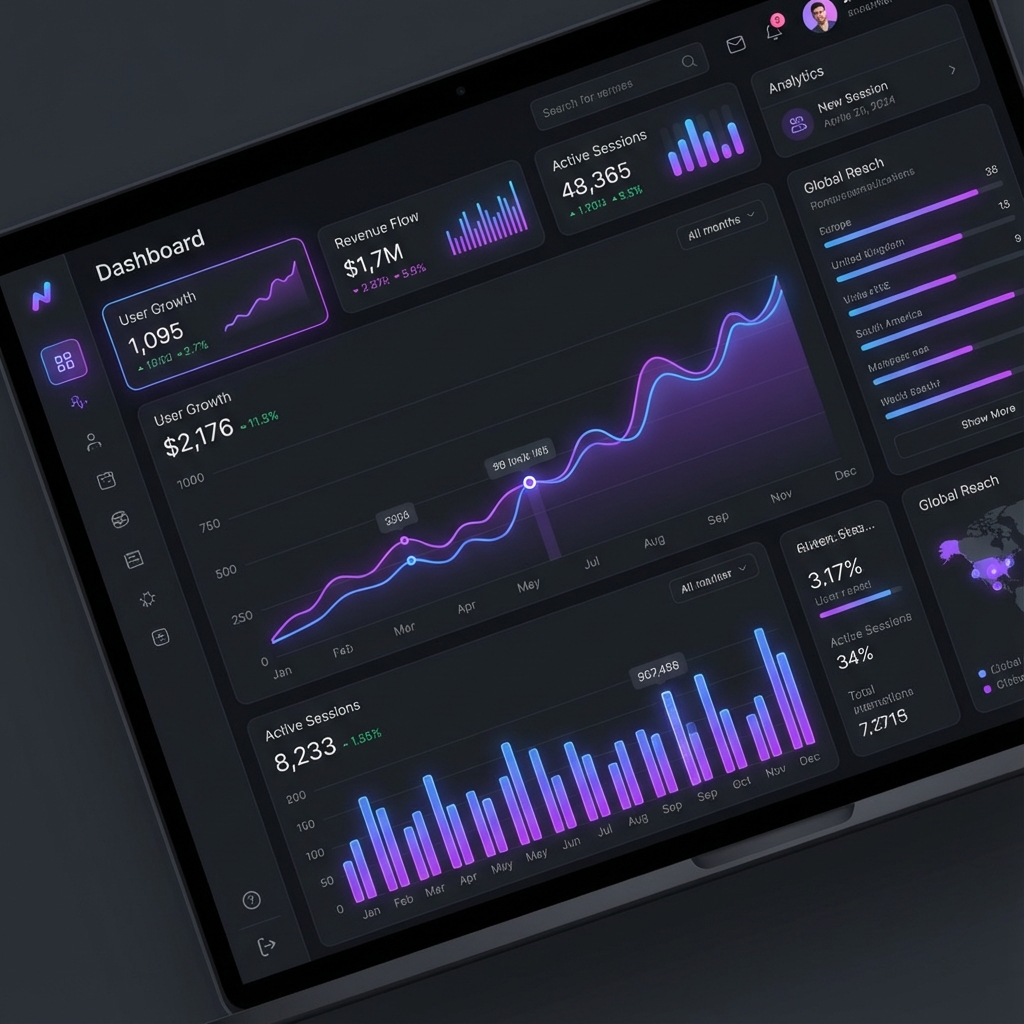
Cluster Dashboard
Real time infrastructure at a glance.
Role
DevOps Engineer
Year
2024
Stack
Kubernetes / Grafana / Prometheus
Links
The Challenge
Running a self hosted Kubernetes cluster requires constant visibility into resource usage, pod health, and network activity. Traditional monitoring setups live on separate dashboards disconnected from the applications they serve.
The Solution
A live Grafana dashboard embedded directly into this portfolio, showing real time metrics from a bare metal Kubernetes cluster. Built with Prometheus for metrics collection and Grafana for visualization, demonstrating seamless integration of monitoring infrastructure into web applications.
Key Highlights
What makes this project stand out
Live embedded Grafana dashboard with real time updates
Prometheus metrics collection across all nodes and pods
CPU, memory, network, and storage monitoring
Bare metal Kubernetes cluster management
Seamless web integration via iframe embedding
Gallery
Visual Impressions
Real time Kubernetes cluster metrics
Technologies
Built With
Next Project
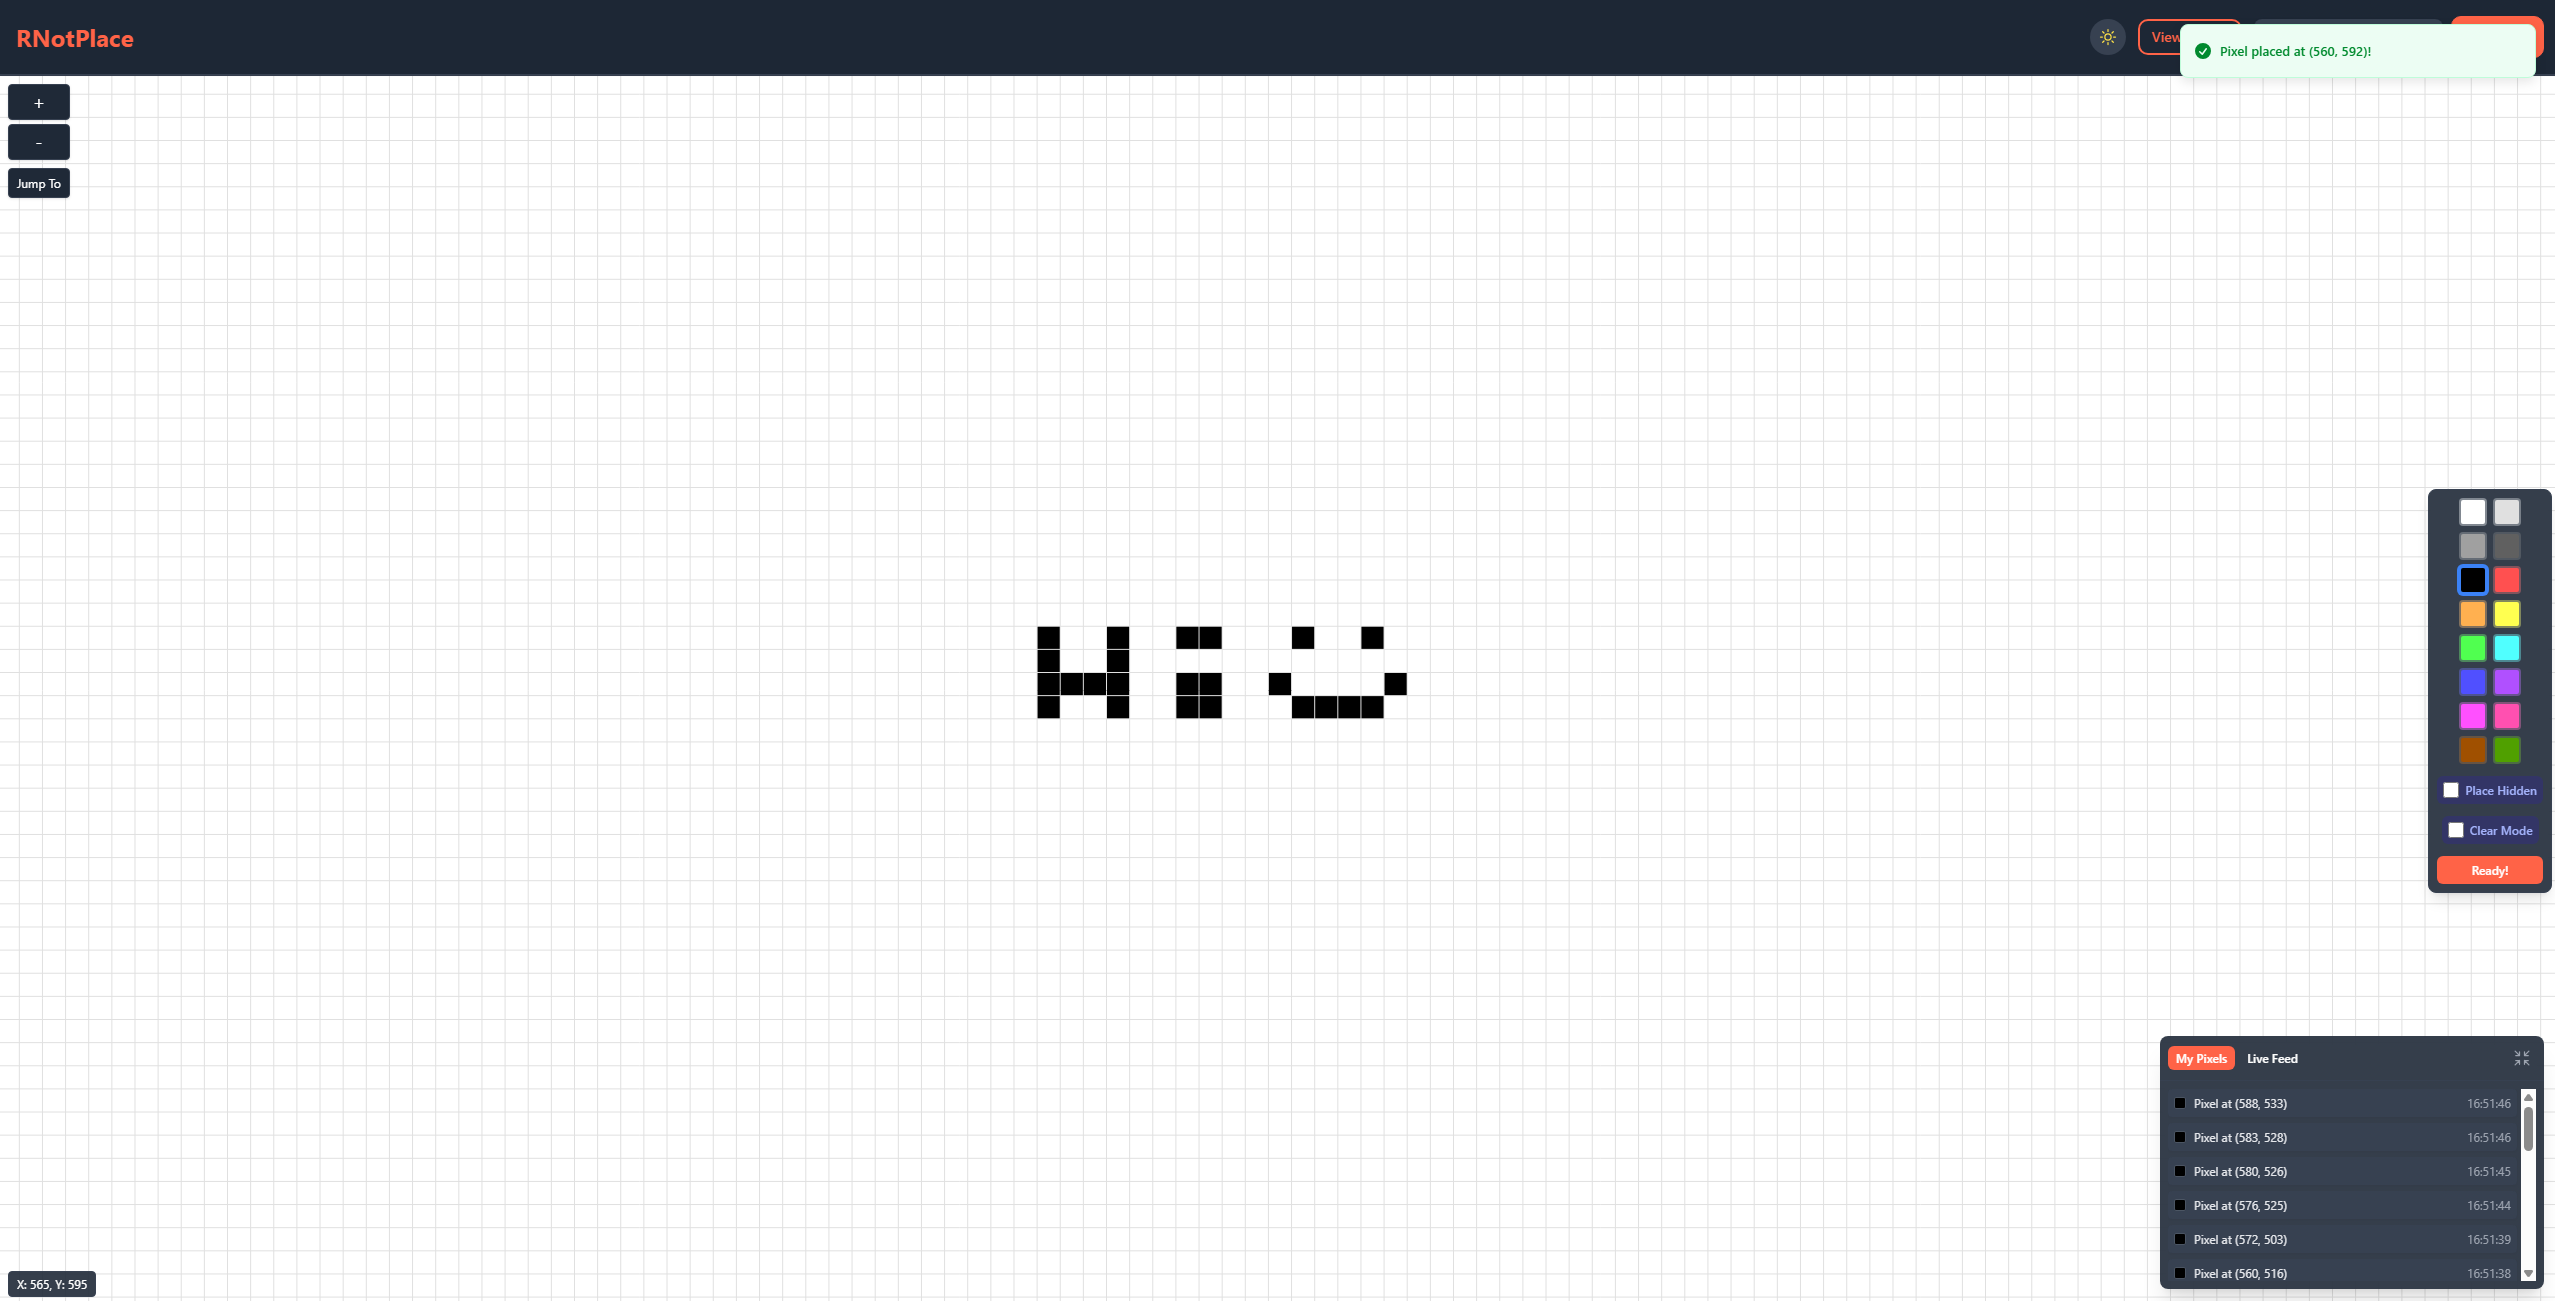
r/notplace
Collaborative pixel art, one pixel at a time.
View Project